Navigation: People | Reporting
Jemini reporting is visually appealing and interactive. We've customised the layout of each report to best present the available data. You can click or tap on each metric to examine the data in more detail, honing in on specific pieces of information.
Types of reports we deliver
-
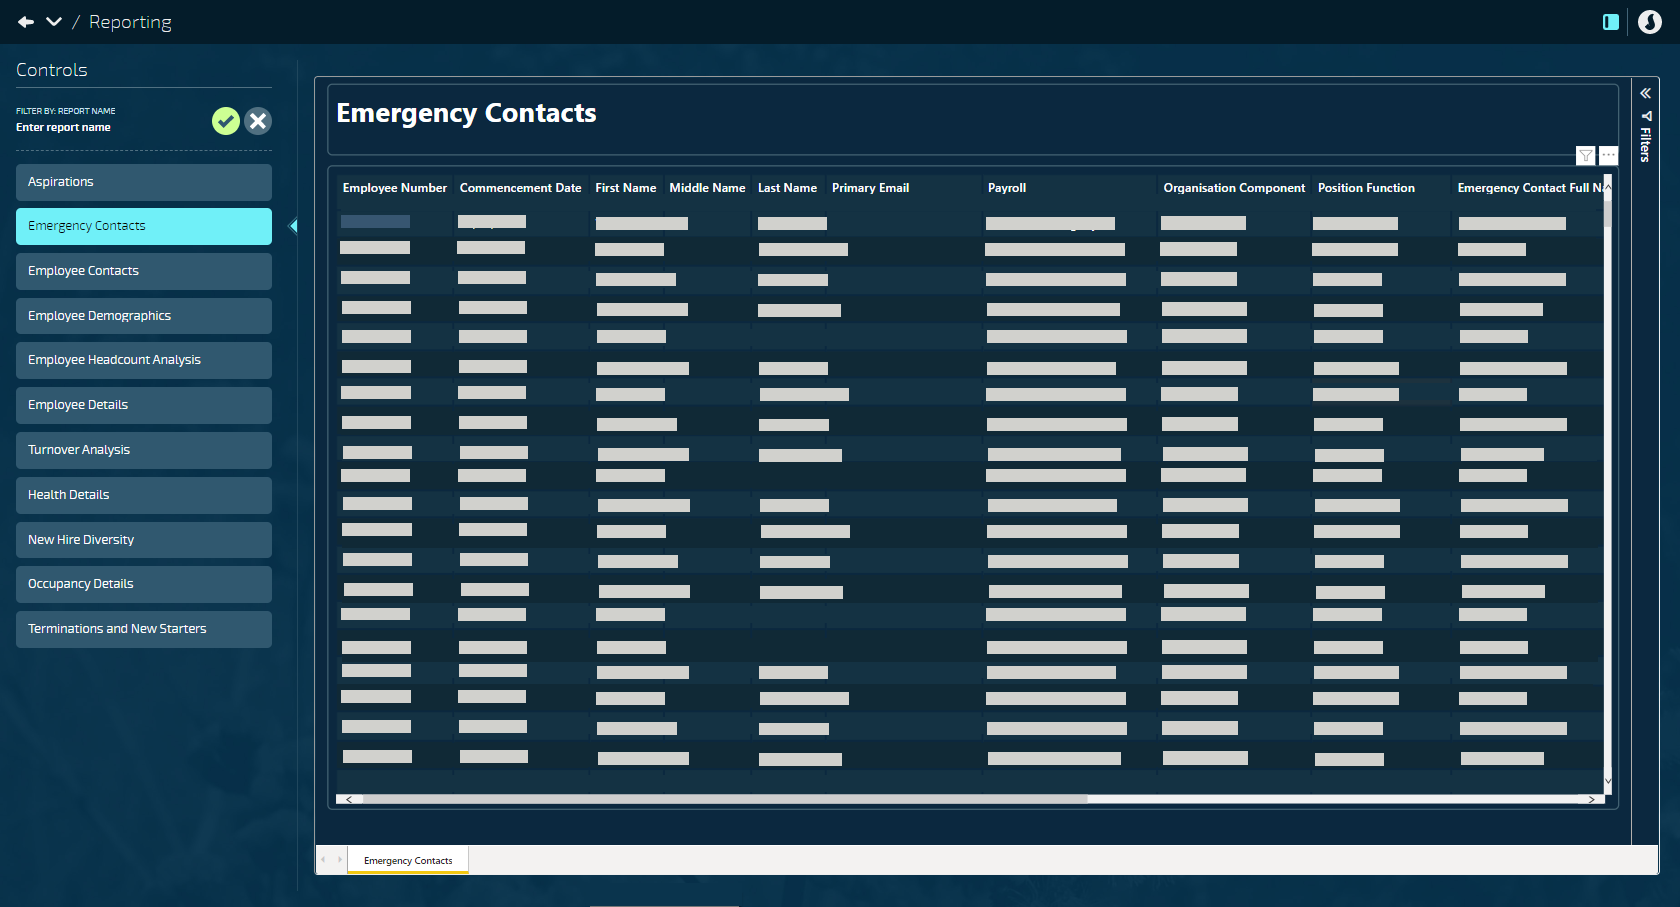
Direct query - These reports are tabled. The data is retrieved after each click with in the Power BI report. Some reports are paginated to increase loading speed (each page of the report loads one at a time). You many need to select the next pages to review all of the data
-
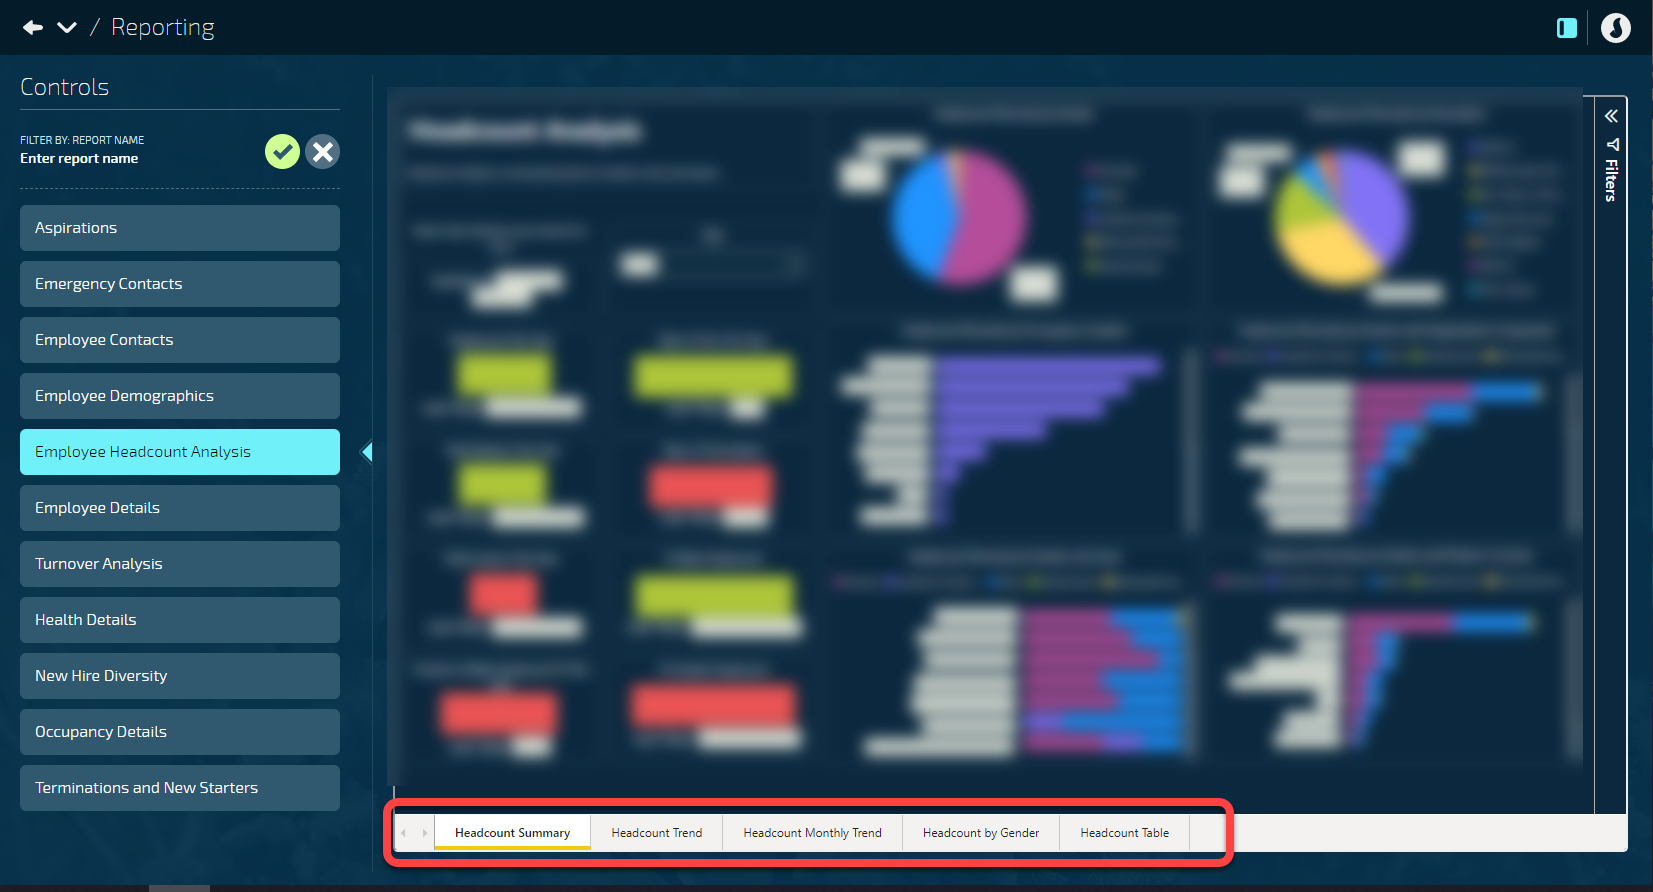
Import mode report - We take a snap shot of the data every 4-24 hours and then present that data in a variety of attractive visualisations like Pie Graphs, Bar Charts, Line etc

- Click or tap on a metric to examine the data in more detail
- Click or tap on the metric again, or on the background around the metric, to go back to the original view
- Some metrics have hierarchy settings which you can examine using the arrow icons
What is Power BI?
Power BI is a business analytics service by Microsoft. It aims to provide interactive visualisations and business intelligence capabilities with an interface simple enough for end users to create their own reports and dashboards. It is part of the Microsoft Power Platform which is embedded into Jemini.
Reporting features
-
Tabs - Multiple tabs allow you to view different sections of data
-
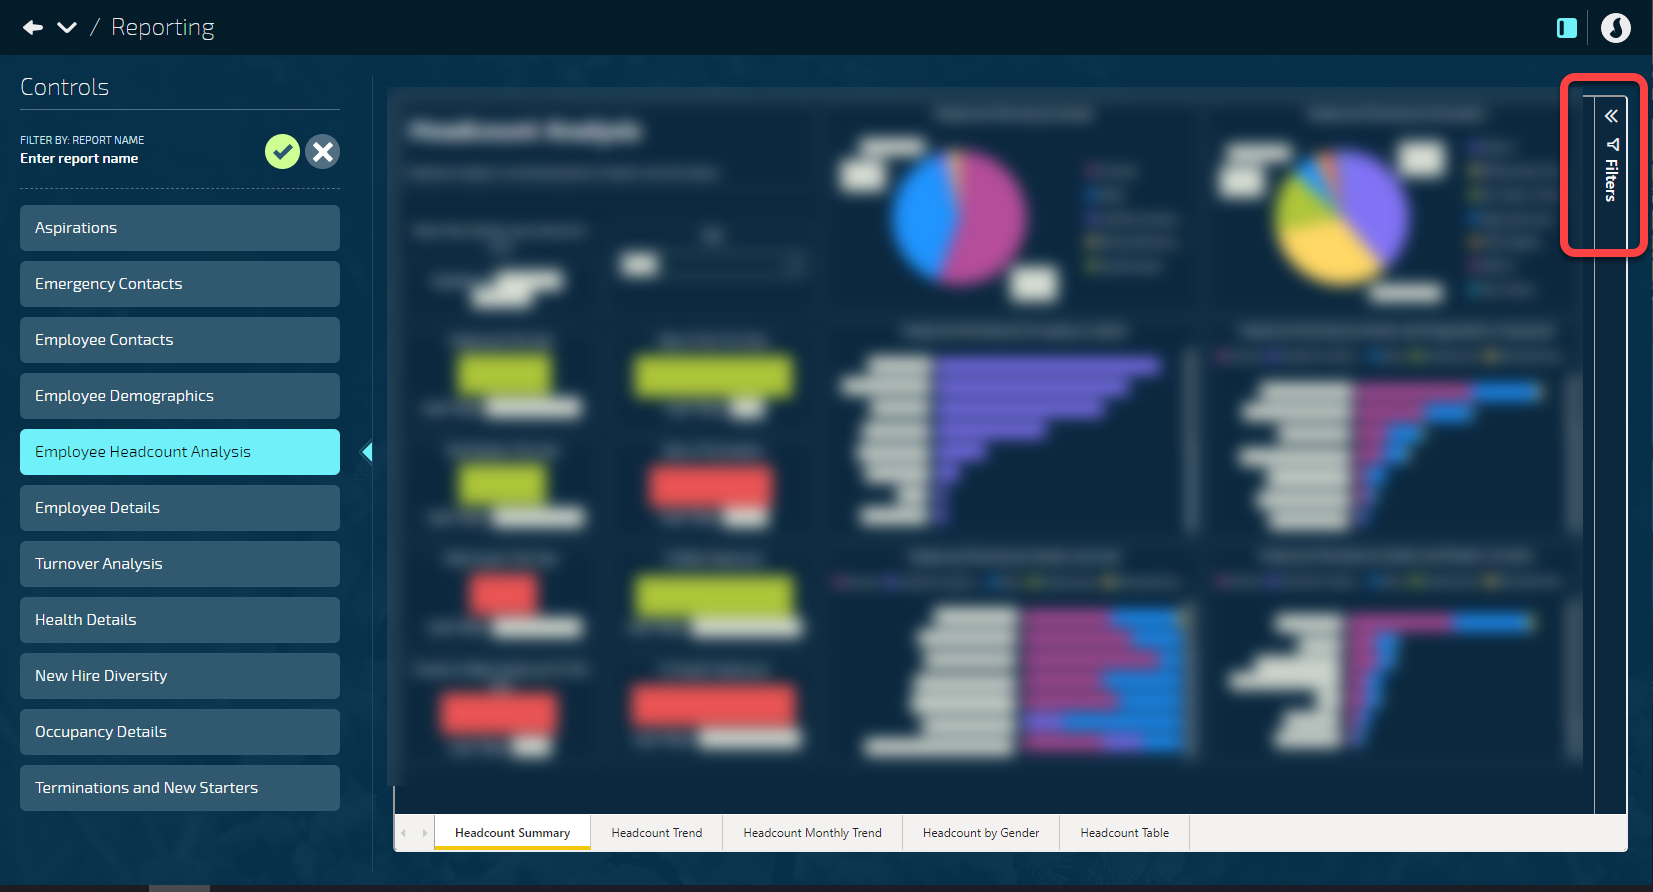
Filters - To the right is a Filters pane with a selection of filters that relate to the data
-
Download the data to CSV - Select the 3 dots icon (...) then Export data
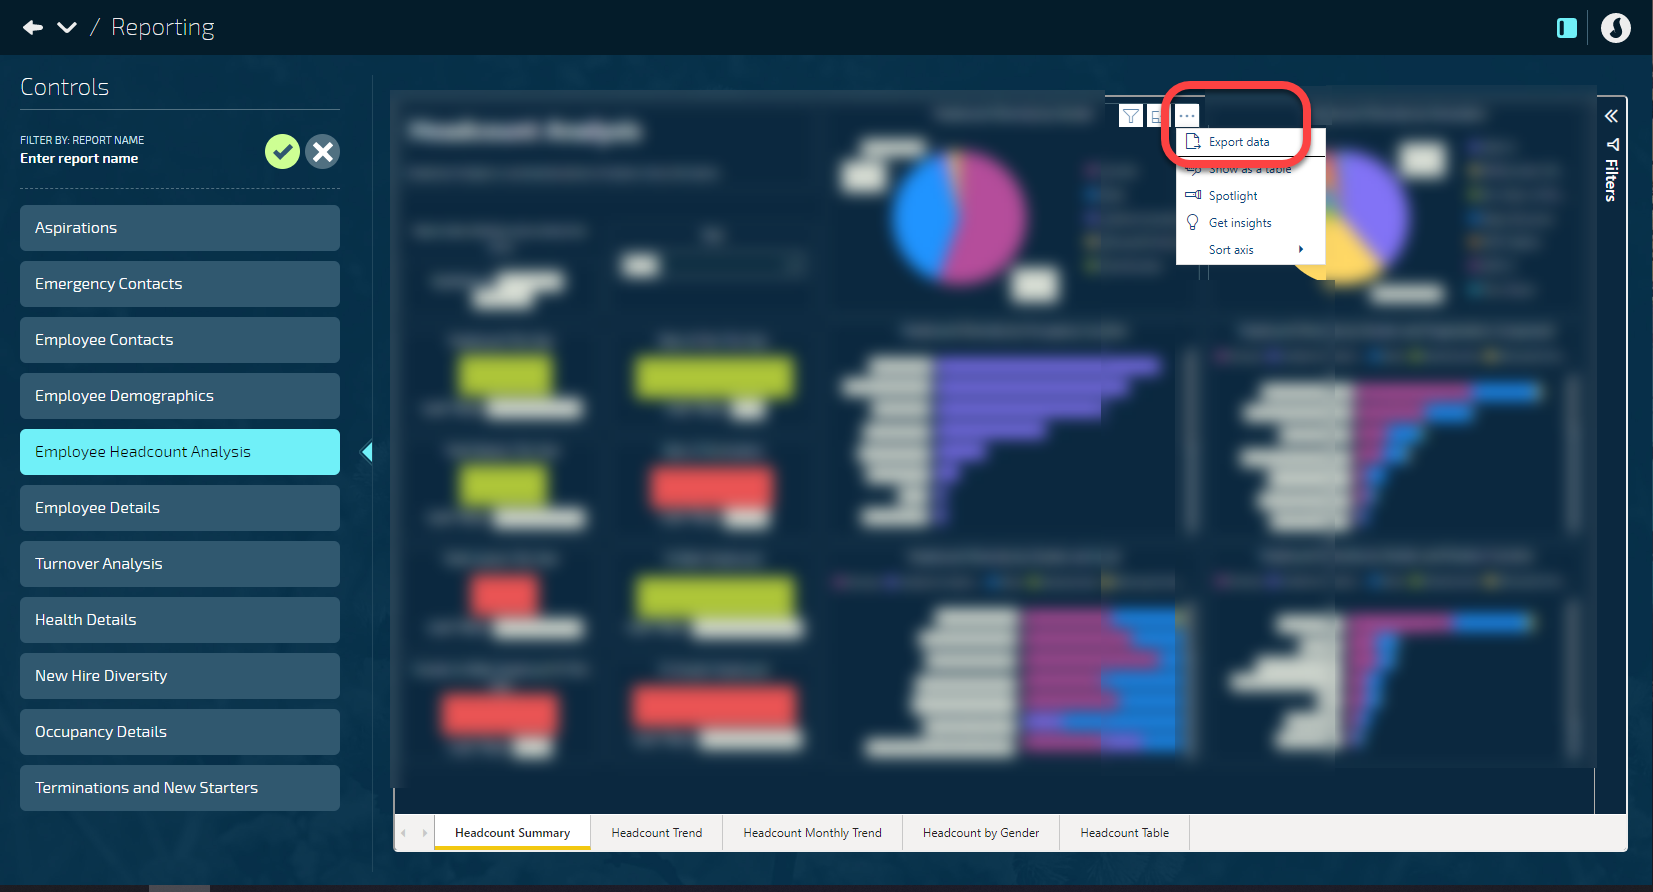
-
Export the view as a PNG, PPTX, or PDF for presentation purposes
You can’t use filters and then export
- View a tabled version of the data - Right click on a metric to Show as a table. You can also Include or Exclude a metric if you wish
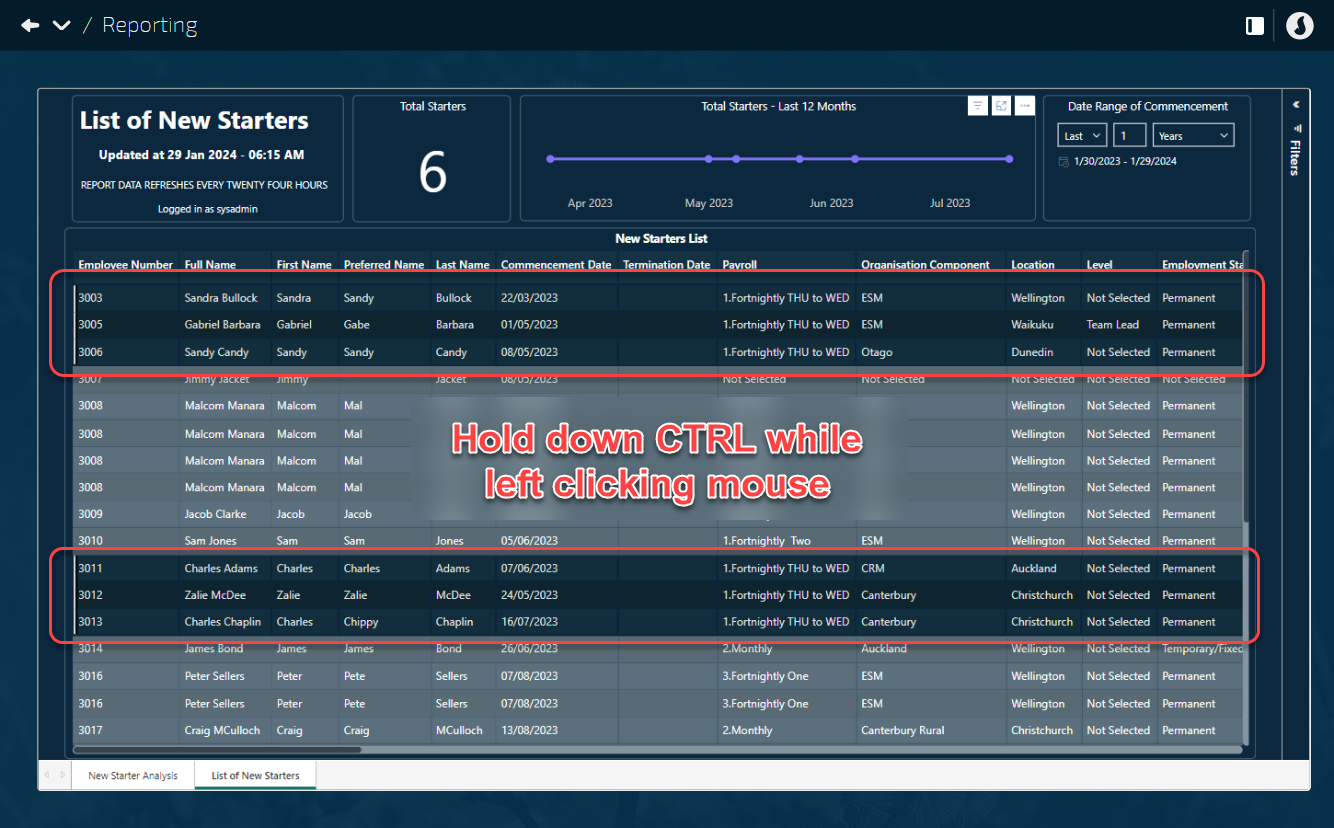
- Make multiple selections on a report - Hold down CTRL on your keyboard while selecting multiple items with your mouse. Click away from the selections to deselect.